
We deliver better MX end-to-end
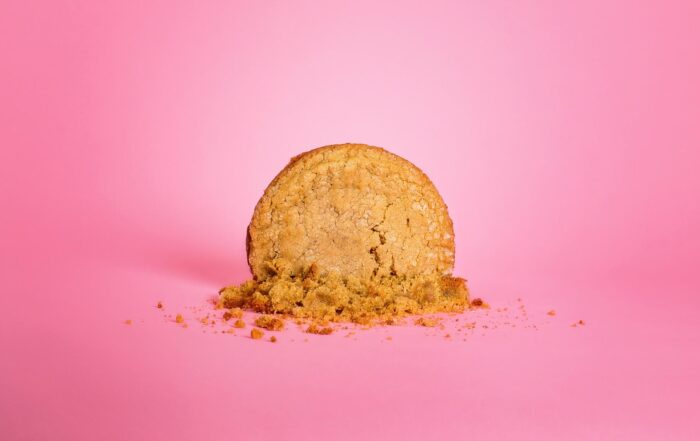
Quad is obsessed with streamlining the marketing experience (MX) so brands can perfect their customer experience (CX).

2,700+ brands are built on Quad
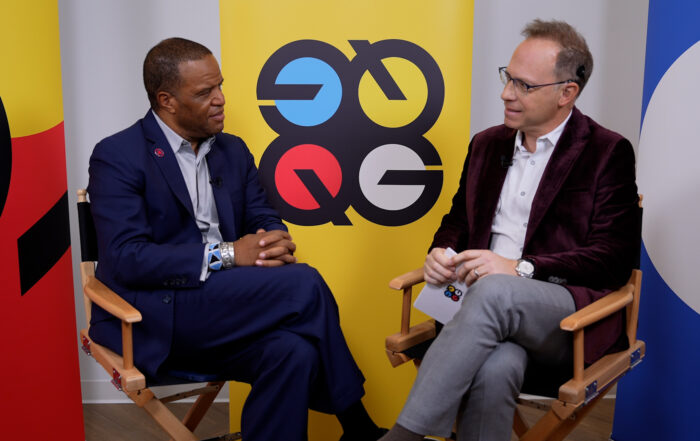
Industry leaders call on Quad when they need solutions that drive real, impactful results.


Culture at Quad
Quad is powered by our people. We are invested in their growth, their health and their well-being. Our global team is empowered to be their best selves and create new possibilities as we grow together. We’re always looking for makers, thinkers, innovators and learners to be a part of our story.
